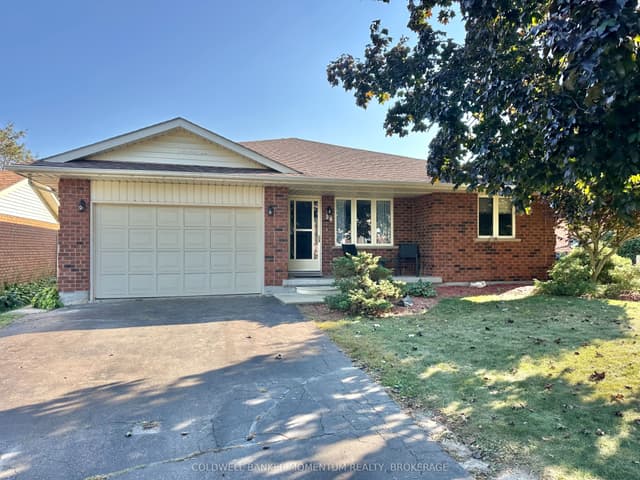
New listing, listed 12 h ago
$498,900
2 bd · 2 ba · 1100-1500 sq ft
38 Mann Avenue, Norfolk, ON N3Y 5J2
Norfolk · Detached
Norfolk County has 374 homes and properties for sale on the MLS® right now. The median asking price for a home is $699,900. 23 new listings came on the market in the last 7 days. Detached houses are the largest share, at 84% of home listings.
Currently a buyer's market in Norfolk County. Browse 373 MLS® listings, neighbourhood market stats, and recent sold history across Norfolk County, Ontario.

Norfolk County at a glance
MLS® data
Market typeBuyer's market · 15/100
58 days on market (average) · 5.8 months of inventory
Fresh on the market
1 of the 8 newest MLS® listings below went live today. Newest first.

Meet Zara · Norfolk County
Ask Zara about any listing, neighbourhood, school zone, or sold comparable in Norfolk County. Available 24/7 via chat or phone — no signup, no waiting.
374 homes are listed for sale in Norfolk County on the MLS® right now. 23 of them were listed in the last 7 days.
Ask Zara a follow-upAs of October 2026, homes for sale in Norfolk County have an average asking price of $833,110 and a median of $699,900 across 272 MLS® listings. A detached house has a median asking price of $749,900, against $428,950 for a condo. Over the last 12 months, the median sold price was $585,000 across 449 sales.
Ask Zara a follow-upRight now it reads as a buyer's market: homes are taking about 58 days to sell and there are about 5.8 months of supply. That can change month to month, so ask before you make an offer.
Ask Zara a follow-up8 homes have had the asking price cut in the last two weeks. See them in the price drops row above.
Ask Zara a follow-upNorfolk County, Ontario has 373 homes listed for sale, 160 sold in the last 90 days and a 90-day median sold price of $592,030, from the MLS®. Through Mortgage Squad Advisors — Summitly's preferred mortgage partner — you can browse listings and talk to a licensed mortgage advisor in the same flow.
Loading map…

23 homes were listed for sale in Norfolk County in the last 7 days. The newest first.
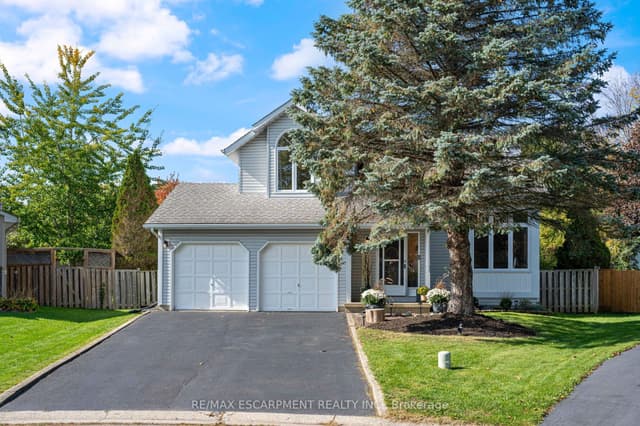
2 bd · 2 ba · 1100-1500 sq ft
38 Mann Avenue, Norfolk, ON N3Y 5J2
Norfolk · Detached
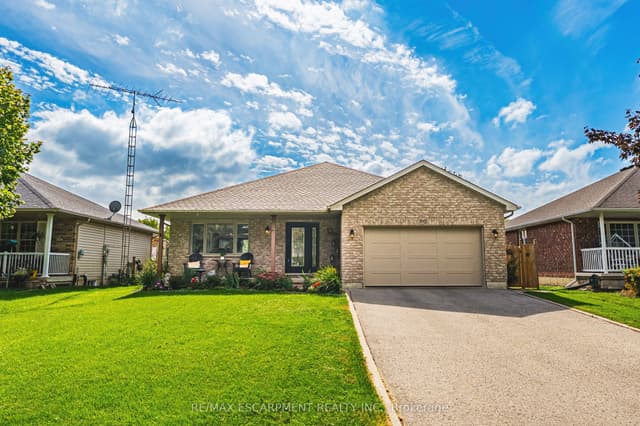
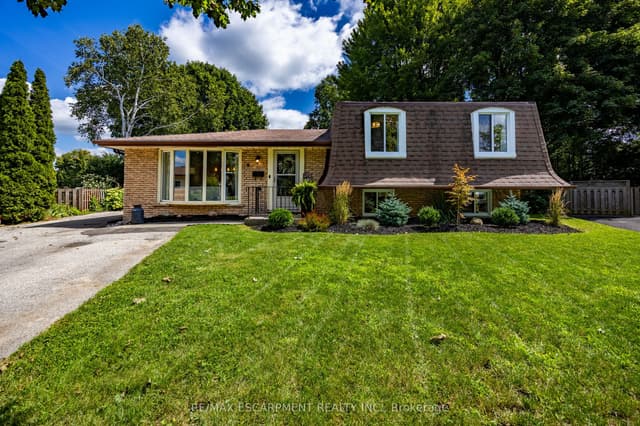
3 bd · 2 ba · 1100-1500 sq ft
915 St George Street, Norfolk, ON N0A 1N0
Norfolk · Detached
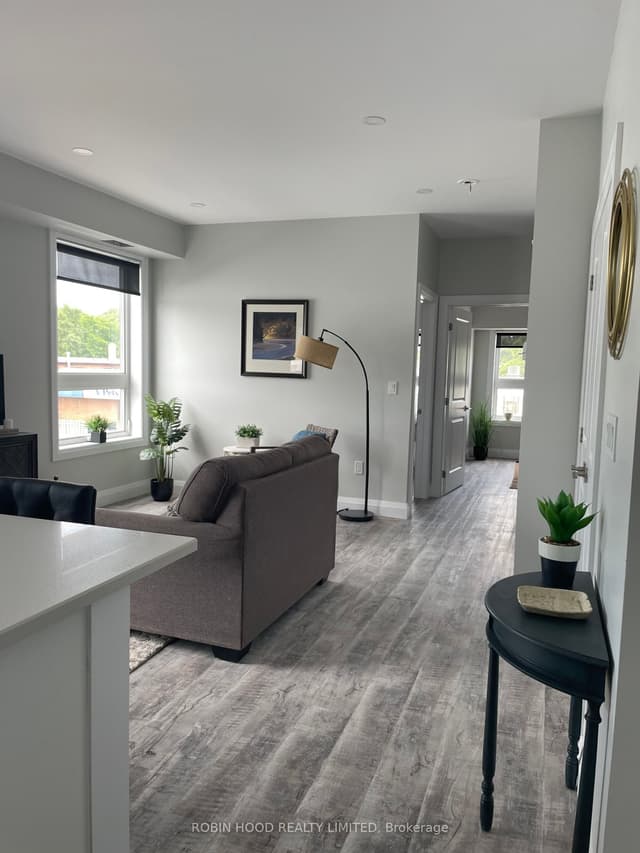
2 bd · 1 ba · 700-1100 sq ft
124 King Street 303, Norfolk, ON N4B 1X8
Norfolk · Store W Apt/Office

2 bd · 2 ba · 1200-1399 sq ft
5 Yin Street 3, Norfolk, ON N0E 1Y0
Norfolk · Condo Townhouse
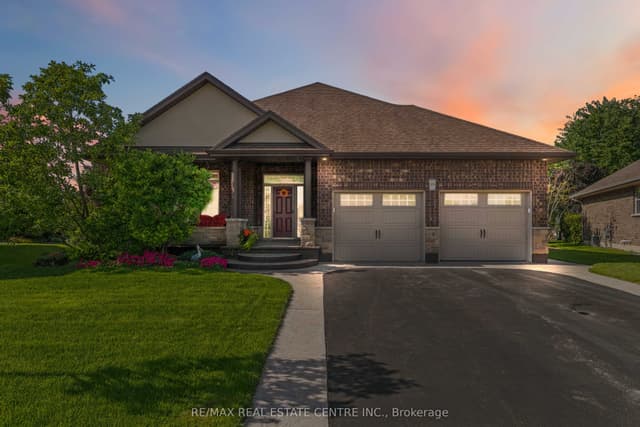
3 bd · 2 ba · 1500-2000 sq ft
99 Magnolia Drive, Norfolk, ON N0A 1N6
Norfolk · Detached
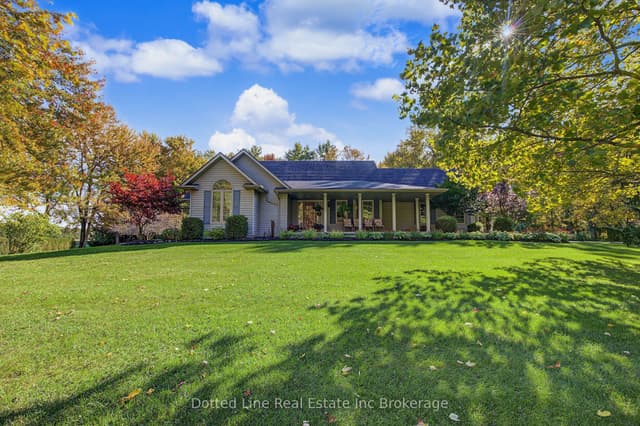
3 bd · 3 ba · 2000-2500 sq ft
1324 Mall Road, Norfolk, ON N4G 4G7
Norfolk · Detached
Listed 2 days ago
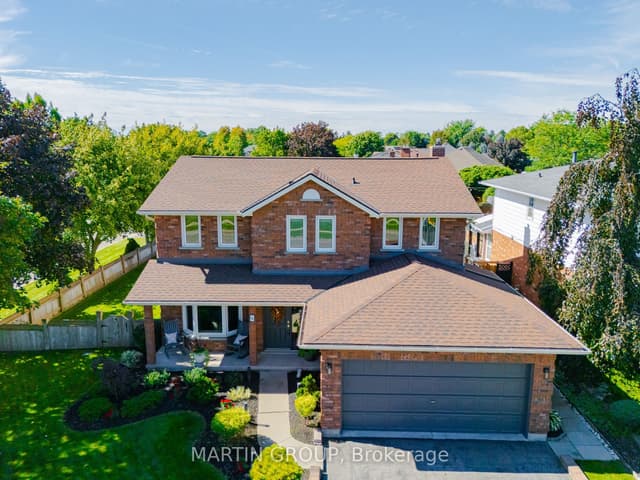
4 bd · 2 ba · 2000-2500 sq ft
30 Donly Drive S, Norfolk, ON N3Y 5G8
Norfolk · Detached
Listed 2 days ago
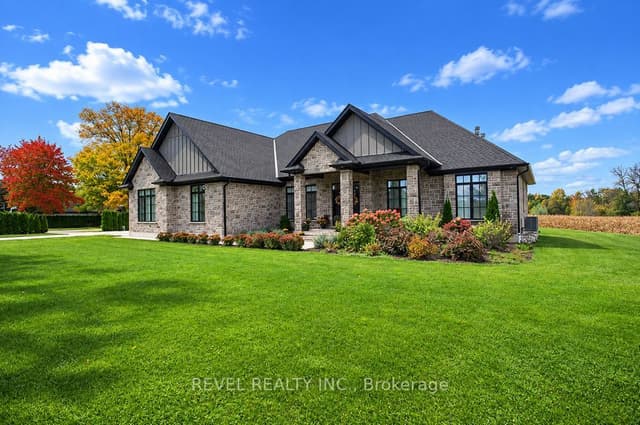
3 bd · 3 ba · 2000-2500 sq ft
572 Concession 6 Townsend, Norfolk, ON N0E 1Y0
Norfolk · Farm
Listed 2 days ago
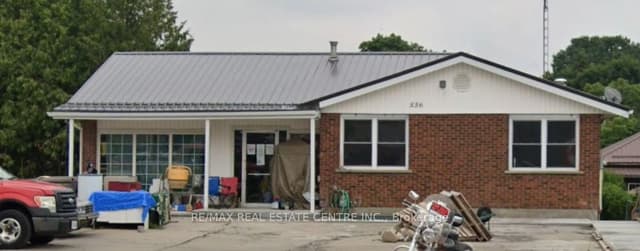
0 bd · 0 ba
556 James Street, Norfolk, ON N4B 2C4
Norfolk · Commercial Retail
−90.0% from $5,990,000 · Listed 2 days ago
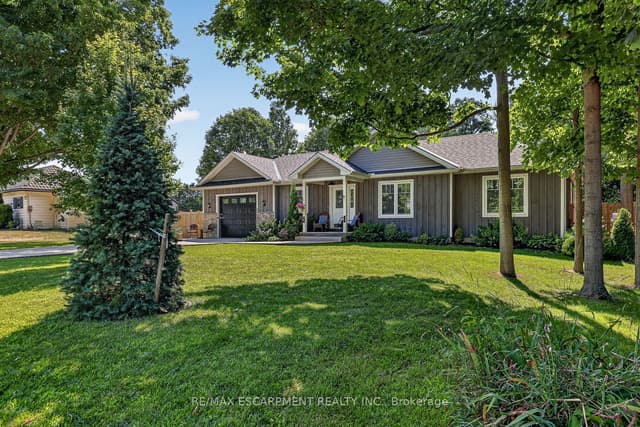
1 bd · 1 ba · 700-1100 sq ft
729 6th Concession Rd Enr, Norfolk, ON N0E 1C0
Norfolk · Detached
Listed 2 days ago
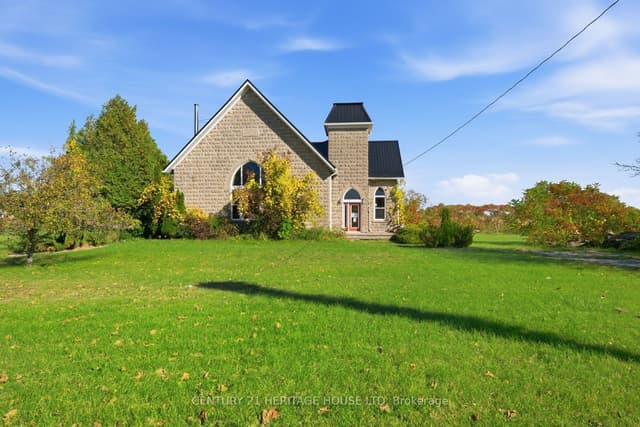
4 bd · 1 ba · 2500-3000 sq ft
205 Norfolk County 45 Road, Norfolk, ON N0E 1G0
Norfolk · Detached
Listed 2 days ago
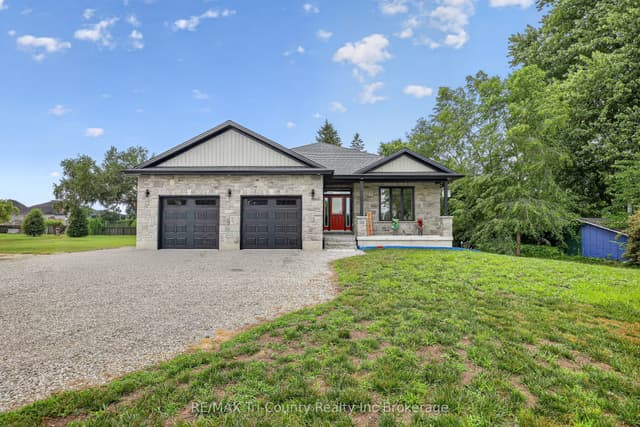
2 bd · 3 ba · 1500-2000 sq ft
520 Fairground Road W, Norfolk, ON N0E 1G0
Norfolk · Detached
Listed 3 days ago
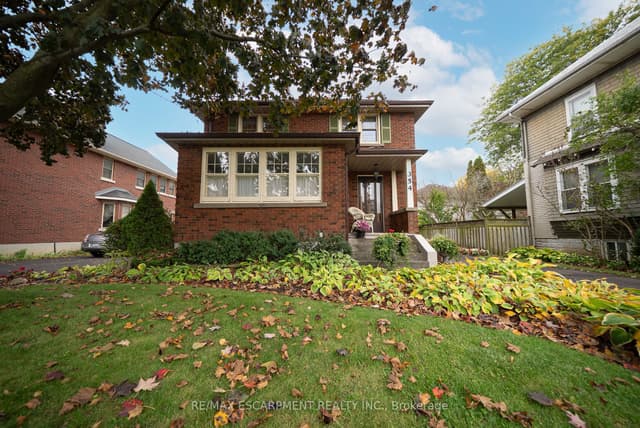
3 bd · 1 ba · 1500-2000 sq ft
354 West Street W, Norfolk, ON N3Y 1T5
Norfolk · Detached
Listed 4 days ago
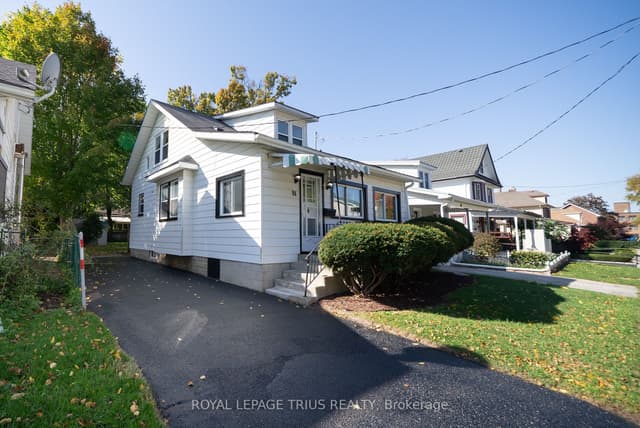
3 bd · 1 ba · 1100-1500 sq ft
94 Brook Street, Norfolk, ON N3Y 3G5
Norfolk · Detached
Listed 4 days ago
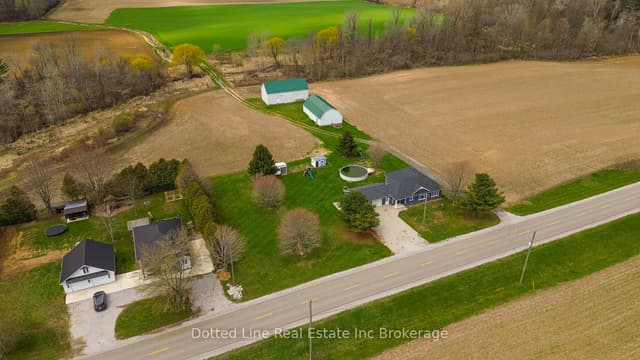
3 bd · 1 ba · 1500-2000 sq ft
573 Norfolk County Rd 28 Road W, Norfolk, ON N0E 1G0
Norfolk · Detached
Listed 5 days ago
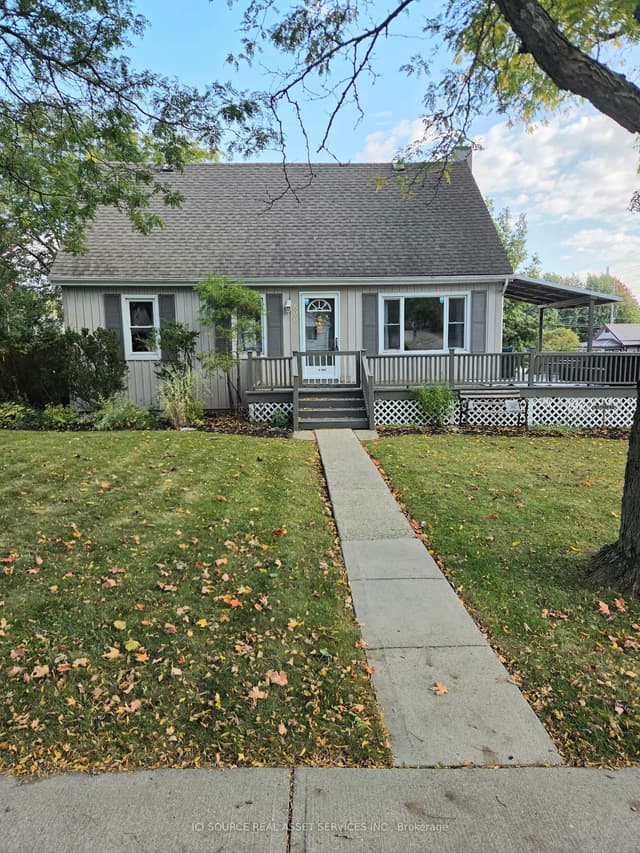
2 bd · 2 ba · 1100-1500 sq ft
500 St Andrew Street, Norfolk, ON N0A 1N0
Norfolk · Detached
Listed 5 days ago
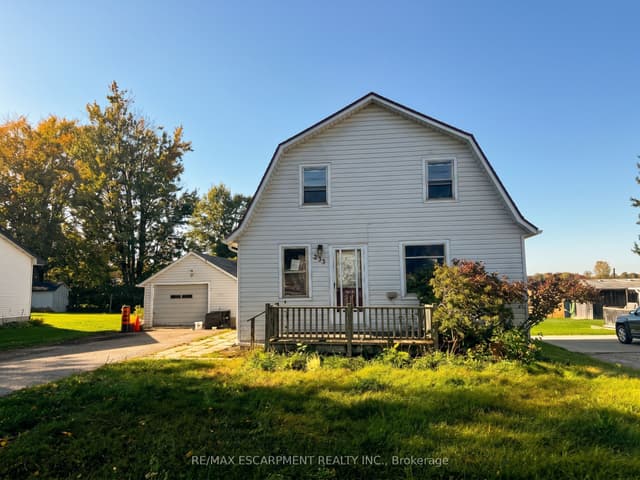
2 bd · 2 ba · 1100-1500 sq ft
233 Talbot Street, Norfolk, ON N0J 1E0
Norfolk · Detached
Listed 5 days ago
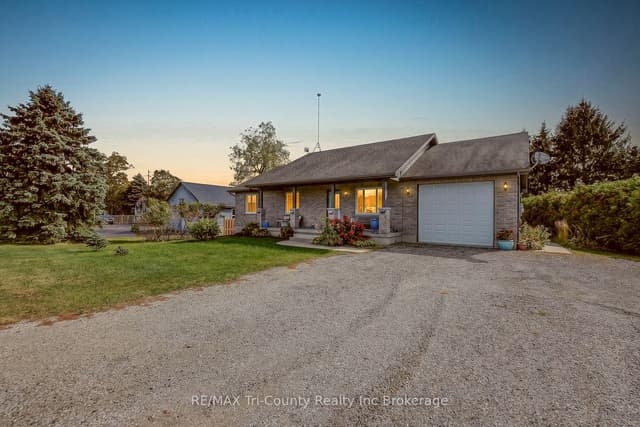
3 bd · 3 ba · 1100-1500 sq ft
342 Glen Meyer Road, Norfolk, ON N0E 1G0
Norfolk · Detached
Listed 5 days ago
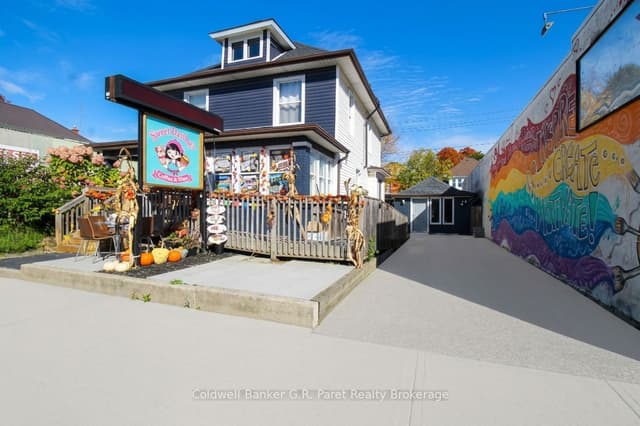
0 bd · 0 ba
39 Norfolk Street N, Norfolk, ON N3Y 3N6
Norfolk · Store W Apt/Office
Listed 5 days ago

1 bd · 2 ba · 1000-1199 sq ft
409 QUEEN Street 4, Norfolk, ON N3Y 0A1
Norfolk · Semi-Detached Condo
Listed 5 days ago
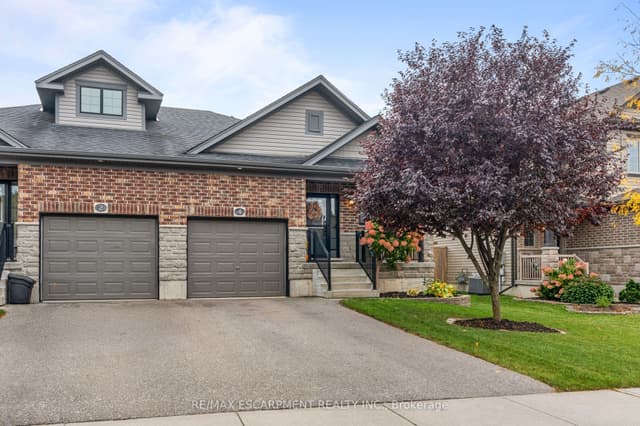
3 bd · 1 ba · 1100-1500 sq ft
4 Basswood Road, Norfolk, ON N3Y 0C7
Norfolk · Semi-Detached
Listed 5 days ago
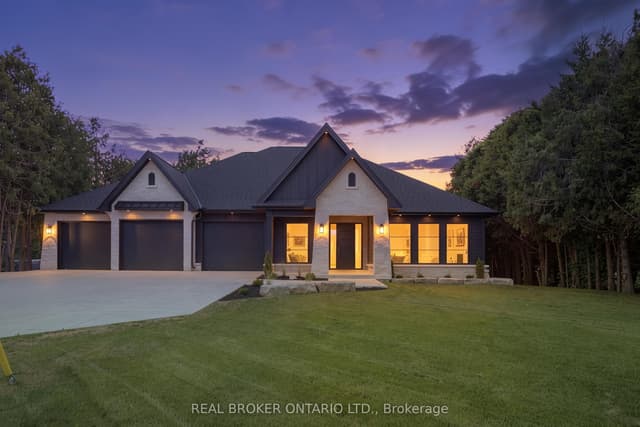
3 bd · 2 ba · 2000-2500 sq ft
11 Concession 13 Townsend Road, Norfolk, ON N3Y 4K3
Norfolk · Detached
Listed 6 days ago
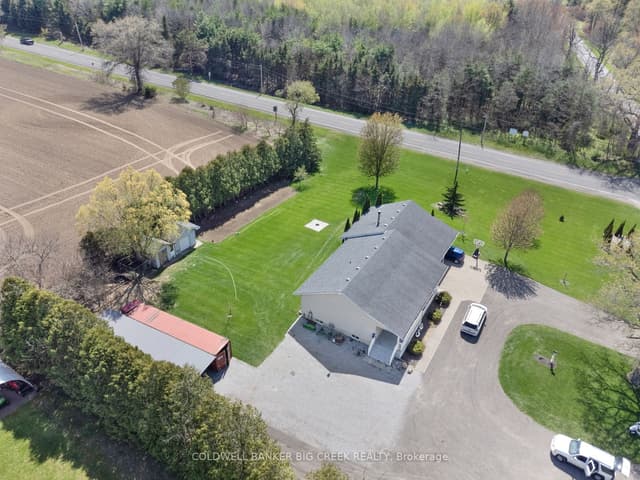
2 bd · 2 ba · 1500-2000 sq ft
29 Leslie Avenue, Norfolk, ON N0A 1N4
Norfolk · Detached
Listed 6 days ago
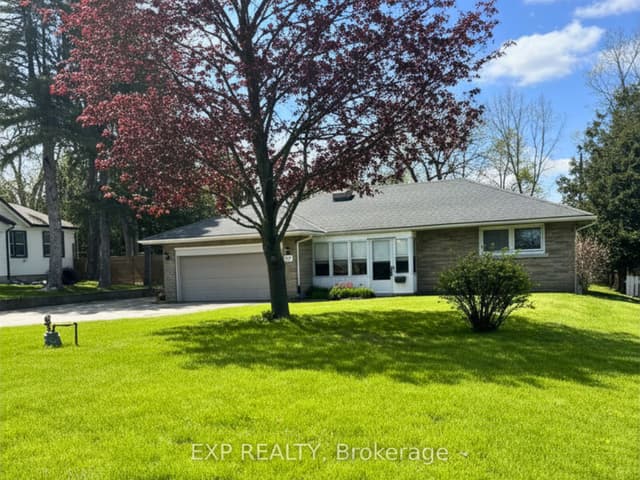
3 bd · 2 ba · 1100-1500 sq ft
9 Normandy Circle, Norfolk, ON N3Y 4J6
Norfolk · Detached
−3.4% from $589,900 · Listed 6 days ago
Showing 1–24 of 373
Homes whose asking price came down in the last two weeks, most recent cut first.
2 bd · 2 ba · 1100-1500 sq ft
6 Scott Street, Norfolk, ON N4B 1A2
Norfolk · Detached
Listed 43 days ago
2 bd · 1 ba · 1100-1500 sq ft
517 Norfolk Street S, Norfolk, ON N3Y 2X6
Norfolk · Detached
−2.4% from $625,000 · Listed 41 days ago
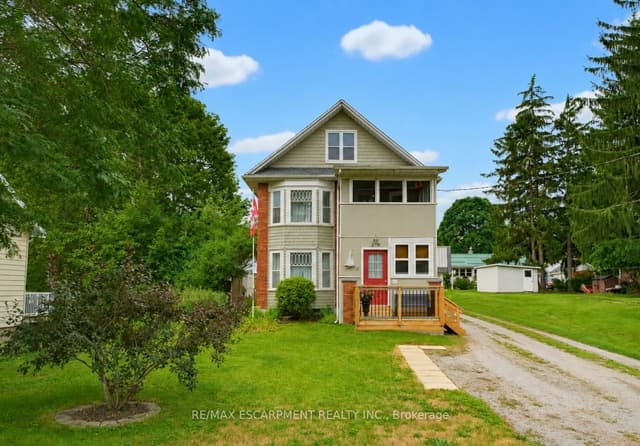
3 bd · 2 ba · 1100-1500 sq ft
19 First Avenue, Norfolk, ON N0A 1N0
Norfolk · Duplex
−6.1% from $649,900 · Listed 64 days ago

1 bd · 2 ba · 1000-1199 sq ft
5 YIN Street 6, Norfolk, ON N0E 1Y0
Norfolk · Condo Townhouse
−3.5% from $569,900 · Listed 65 days ago
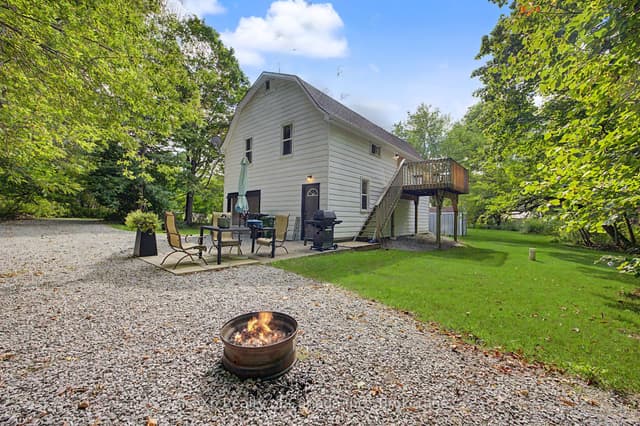
3 bd · 2 ba · 1100-1500 sq ft
175 Lynedoch Road, Norfolk, ON N4B 2W4
Norfolk · Detached
−4.8% from $499,000 · Listed 35 days ago
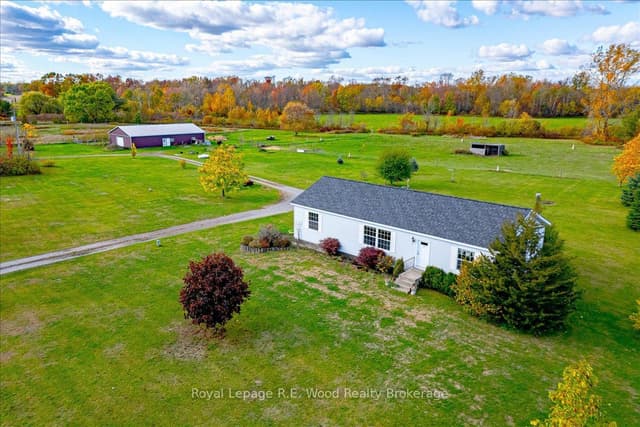
3 bd · 2 ba · 1500-2000 sq ft
1319 Windham Road 9 Road, Norfolk, ON N0E 2A0
Norfolk · Farm
−1.9% from $1,299,900 · Listed 103 days ago
3 bd · 2 ba
1319 Windham Road 9 Road, Norfolk, ON N0E 2A0
Norfolk · Farm
−1.9% from $1,299,900 · Listed 103 days ago
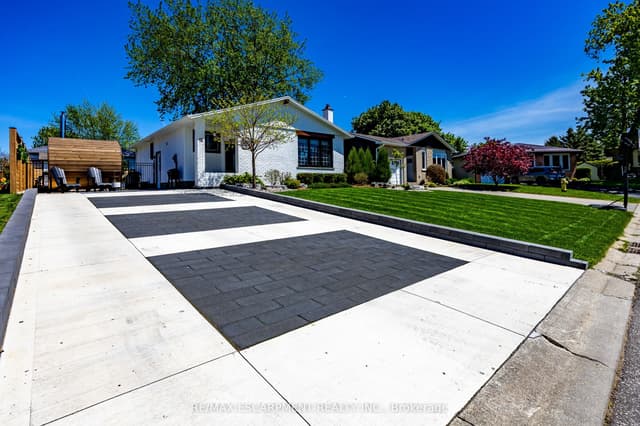
3 bd · 2 ba · 1100-1500 sq ft
12 Westdale Avenue, Norfolk, ON N0A 1N4
Norfolk · Detached
−3.2% from $649,900 · Listed 37 days ago
Asking prices of the Norfolk County homes for sale on the MLS® today, by property type, with the median sold price over the last 12 months. Updated October 2026.
As of October 2026, homes for sale in Norfolk County have an average asking price of $833,110 and a median of $699,900 across 272 MLS® listings. A detached house has a median asking price of $749,900, against $428,950 for a condo. Over the last 12 months, the median sold price was $585,000 across 449 sales.
| Type | For sale | Average asking | Median asking | Asking $/sq ft | Median days listed | Median sold (12 mo) |
|---|---|---|---|---|---|---|
| All homes | 272 | $833,110 | $699,900 | $550 | 44 | $585,000 |
| Detached | 228 | $890,886 | $749,900 | $571 | 43 | $612,250 |
| Semi-detached | 7 | $545,914 | $565,000 | $468 | 71 | $515,000 |
| Townhouse | 24 | $575,417 | $554,450 | $472 | 44 | $500,000 |
| Condo | 6 | $430,133 | $428,950 | $342 | 47 | Not enough recent sales |
| Multi-family | 7 | $467,371 | $449,900 | $237 | 115 | $530,000 |
Asking figures are from active MLS® listings; $/sq ft uses listings that report a floor area. Sold figures are medians of at least 5 sales — individual sold prices are shown to signed-in members only.
| Month | Average sold price | Sales |
|---|---|---|
| November 2025 | $774,327 | 40 |
| December 2025 | $697,606 | 26 |
| January 2026 | $602,535 | 19 |
| February 2026 | $628,272 | 29 |
| March 2026 | $599,807 | 26 |
| April 2026 | $742,230 | 35 |
| May 2026 | $798,958 | 38 |
| June 2026 | $671,219 | 57 |
| July 2026 | $740,556 | 57 |
| August 2026 | $756,323 | 61 |
| September 2026 | $621,136 | 67 |
| October 2026 | $576,717 | 41 |
How Norfolk County homes have been selling, from MLS® sales. Prices are aggregates of at least 5 sales; sign in to see individual sold prices and dates.
Composite hotness score, the year-long sold-price line, and a plain-English read on the data from Zara, our real estate AI.
Composite score derived from days-on-market and months-of-inventory signals.
Last 12 months of MLS® closed transactions, average per month.
| Month | Avg sold | Closed |
|---|---|---|
| Nov 25 | $774,327 | 40 |
| Dec 25 | $697,606 | 26 |
| Jan 26 | $602,535 | 19 |
| Feb 26 | $628,272 | 29 |
| Mar 26 | $599,807 | 26 |
| Apr 26 | $742,230 | 35 |
| May 26 | $798,958 | 38 |
| Jun 26 | $671,219 | 57 |
| Jul 26 | $740,556 | 57 |
| Aug 26 | $756,323 | 61 |
| Sep 26 | $621,136 | 67 |
| Oct 26 | $576,717 | 41 |
The latest monthly average sold price is roughly 25.5% lower than 12 months earlier. Monthly averages move with the mix of homes that sold, so treat this as a direction rather than a precise change. Supply is at ~5.8 months — between the usual seller's and buyer's thresholds.
Buyers: you have real negotiating power right now. Sellers: consider pre-listing inspections and competitive pricing to stand out.
Active MLS® listings per price band.
Detached, semi-detached, townhouse, condo, multi-family and commercial inventory — all in one view.
Jump straight to the searches buyers and renters use most — each one updated daily from MLS® data.
The way buyers really search — new listings, price drops, with pool, finished basement, fixer-uppers, and more. One tap drops you on the map with that filter applied.
The Norfolk County neighbourhoods with the most homes for sale right now, with each one's median asking price.
Lowest median asking price first, among neighbourhoods with at least 5 homes for sale.
Forward Sortation Areas (the first 3 characters of a Canadian postal code) ranked by current MLS® inventory.
Norfolk County has 373 homes listed for sale on the MLS® right now. The largest groups are detached houses (206), townhouses (23), semi-detached houses (6) and condos (6). Another 26 homes are listed for rent.
Over the last 90 days, 192 homes sold in Norfolk County at a median price of $592,030, after an average of 58 days on the market. Over the last six months, average sold prices were: detached houses $715,889, semi-detached houses $514,986, townhouses $517,529 and multi-family homes $577,200.
At the current pace of sales, Norfolk County's active listings would take about 5.8 months to sell — roughly balanced between buyers and sellers. Summitly's market gauge reads: Norfolk County is leaning toward a buyer's market.
Own a home in Norfolk County? What's my Norfolk County home worth? · Recently sold in Norfolk County · Estimate your selling costs
What buying at Norfolk County's typical asking price costs on top of the price itself, from Ontario's current rules.
On Norfolk County's median asking price of $699,900, Ontario land transfer tax is $10,473. Norfolk County has no municipal land transfer tax; the same home in Toronto would add $10,473 of MLTT.
First-time buyers get up to $4,000 of the provincial tax refunded — $4,000 at this price, leaving $6,473 to pay.
At $699,900, the minimum down payment is $44,990 (6.4% of the price).
The steps Summitly's licensed advisors walk buyers through.
Confirm your maximum purchase price and hold a rate before you start touring properties in Norfolk County. Summitly's mortgage partner, Mortgage Squad Advisors, can compare lenders for you.
Use the price, property-type and bedroom tiles on this page to narrow inventory, or draw your own search area on the map.
Summitly can connect you with a Norfolk County agent at Coldwell Banker Summit Realty, or you can work with your existing REALTOR®.
Compare the asking price with recent sold prices for similar homes nearby — Zara, our real estate AI, can pull comparables for any address.
Your lender, real estate lawyer and agent coordinate the closing so the keys are released on your closing date.
Answered with this page's own MLS® numbers.
The average asking price of a home for sale in Norfolk County is $833,110 as of October 2026, across 272 MLS® listings (median $699,900). Homes that sold in the last 90 days averaged $681,967 over 192 sales. Detached houses average $890,886.
373 homes are listed for sale on the MLS® in Norfolk County, including 206 detached houses, 23 townhouses and 6 semi-detached houses.
Homes that sold in Norfolk County over the last 90 days went for a median of $592,030 and an average of $681,967, across 192 sales. Prices vary widely by property type, size and neighbourhood.
Average sold prices in Norfolk County over the last six months: detached houses $715,889, semi-detached houses $514,986, townhouses $517,529 and multi-family homes $577,200.
Homes that sold in Norfolk County over the last 90 days spent an average of 58 days on the market.
Norfolk County is leaning toward a buyer's market. Norfolk County has about 5.8 months of inventory (active listings divided by monthly sales); under four months usually favours sellers and over six favours buyers.
26 homes are listed for rent on the MLS® in Norfolk County right now.
Listing counts are MLS® counts, updated daily. Sold prices and days on market come from MLS® sales closed in the last 90 days; a figure based on fewer than 5 sales is withheld.
Coldwell Banker Summit Realty, Brokerage
Coldwell Banker Summit Realty, Brokerage is registered with the Real Estate Council of Ontario (RECO). Its licensed agents can help you buy, sell or lease in Norfolk County, from showings and offers to closing. When you are ready to finance, you can compare mortgage options with our partner, Mortgage Squad Advisors.
Coldwell Banker Summit Realty, Brokerage. Waqar Afzal, Broker of Record. Each office is independently owned and operated.
Ready to make a move in Norfolk County?
Estimate what you can afford, talk to a licensed mortgage advisor about pre-approval, or ask Zara for a personal affordability snapshot.
 Coldwell Banker Summit Realty, Brokerage
Zara is an AI virtual agent. Advisors are licensed REALTORS® at Coldwell Banker Summit Realty, Brokerage.